Ultimate Email Marketing Benchmarks for 2022
It’s been a wild couple of years for email marketers.
Sure, you could say that about pretty much everything, but it feels particularly true in the email marketing world, where we have seen some unprecedented statistics and monumental technological changes.
We’re here to make sense of it all with our 2022 Email Marketing Benchmarks Report. This report will give you better insight into how your emails should be performing relative to others in your industry, and what you can do to improve those metrics. Whether you’re wondering if your click-through rates (CTR) are too low, or your unsubscribe rate is too high, you’ll find the answer here in this report.
We’ll also dive into some best practices for improving engagement and measuring your results as you go throughout this year.
How we gathered our data
If you’re not familiar, Campaign Monitor is part of the CM Group family of brands. Together, we make up one of the largest email marketing companies in the world. For this report, we analyzed over 100 billion emails sent across our platforms in 2021 to give you the most comprehensive benchmark data and email marketing stats to date.
Let’s take a look.
Email benchmarks by industry
We’re constantly asked what a good open rate or click-through rate is for email. The short answer is, it depends. Those types of key engagement metrics can vary widely based on your industry (as you can see), and other factors.
| Industry | Open Rates | Click-Through Rates | Click-To-Open Rates | Unsubscribe Rates |
| Advertising & Marketing | 20.5% | 1.8% | 9.0% | 0.2% |
| Agriculture, Forestry, Fishing, Hunting | 27.3% | 3.4% | 12.5% | 0.3% |
| Consumer Packaged Goods | 20% | 1.9% | 11.1% | 0.1% |
| Education | 28.5% | 4.4% | 15.7% | 0.2% |
| Financial Services | 27.1% | 2.4% | 10.1% | 0.2% |
| Restaurant, Food & Beverage | 18.5% | 2.0% | 10.5% | 0.1% |
| Government & Politics | 19.4% | 2.8% | 14.3% | 0.1% |
| Healthcare Services | 23.7% | 3.0% | 13.4% | 0.3% |
| IT/Tech/Software | 22.7% | 2.0% | 9.8% | 0.2% |
| Logistics & Wholesale | 23.4% | 2.0% | 11.7% | 0.3% |
| Media, Entertainment, Publishing | 23.9% | 2.9% | 12.4% | 0.1% |
| Nonprofit | 26.6% | 2.7% | 10.2% | 0.2% |
| Other | 19.9% | 2.6% | 13.2% | 0.3% |
| Professional Services | 19.3% | 2.1% | 11.1% | 0.2% |
| Real Estate, Design, Construction | 21.7% | 3.6% | 17.2% | 0.2% |
| Retail | 17.1% | 0.7% | 5.8% | 0.1% |
| Travel, Hospitality, Leisure | 20.2% | 1.4% | 8.7% | 0.2% |
| Wellness & Fitness | 19.2% | 1.2% | 6.0% | 0.4% |
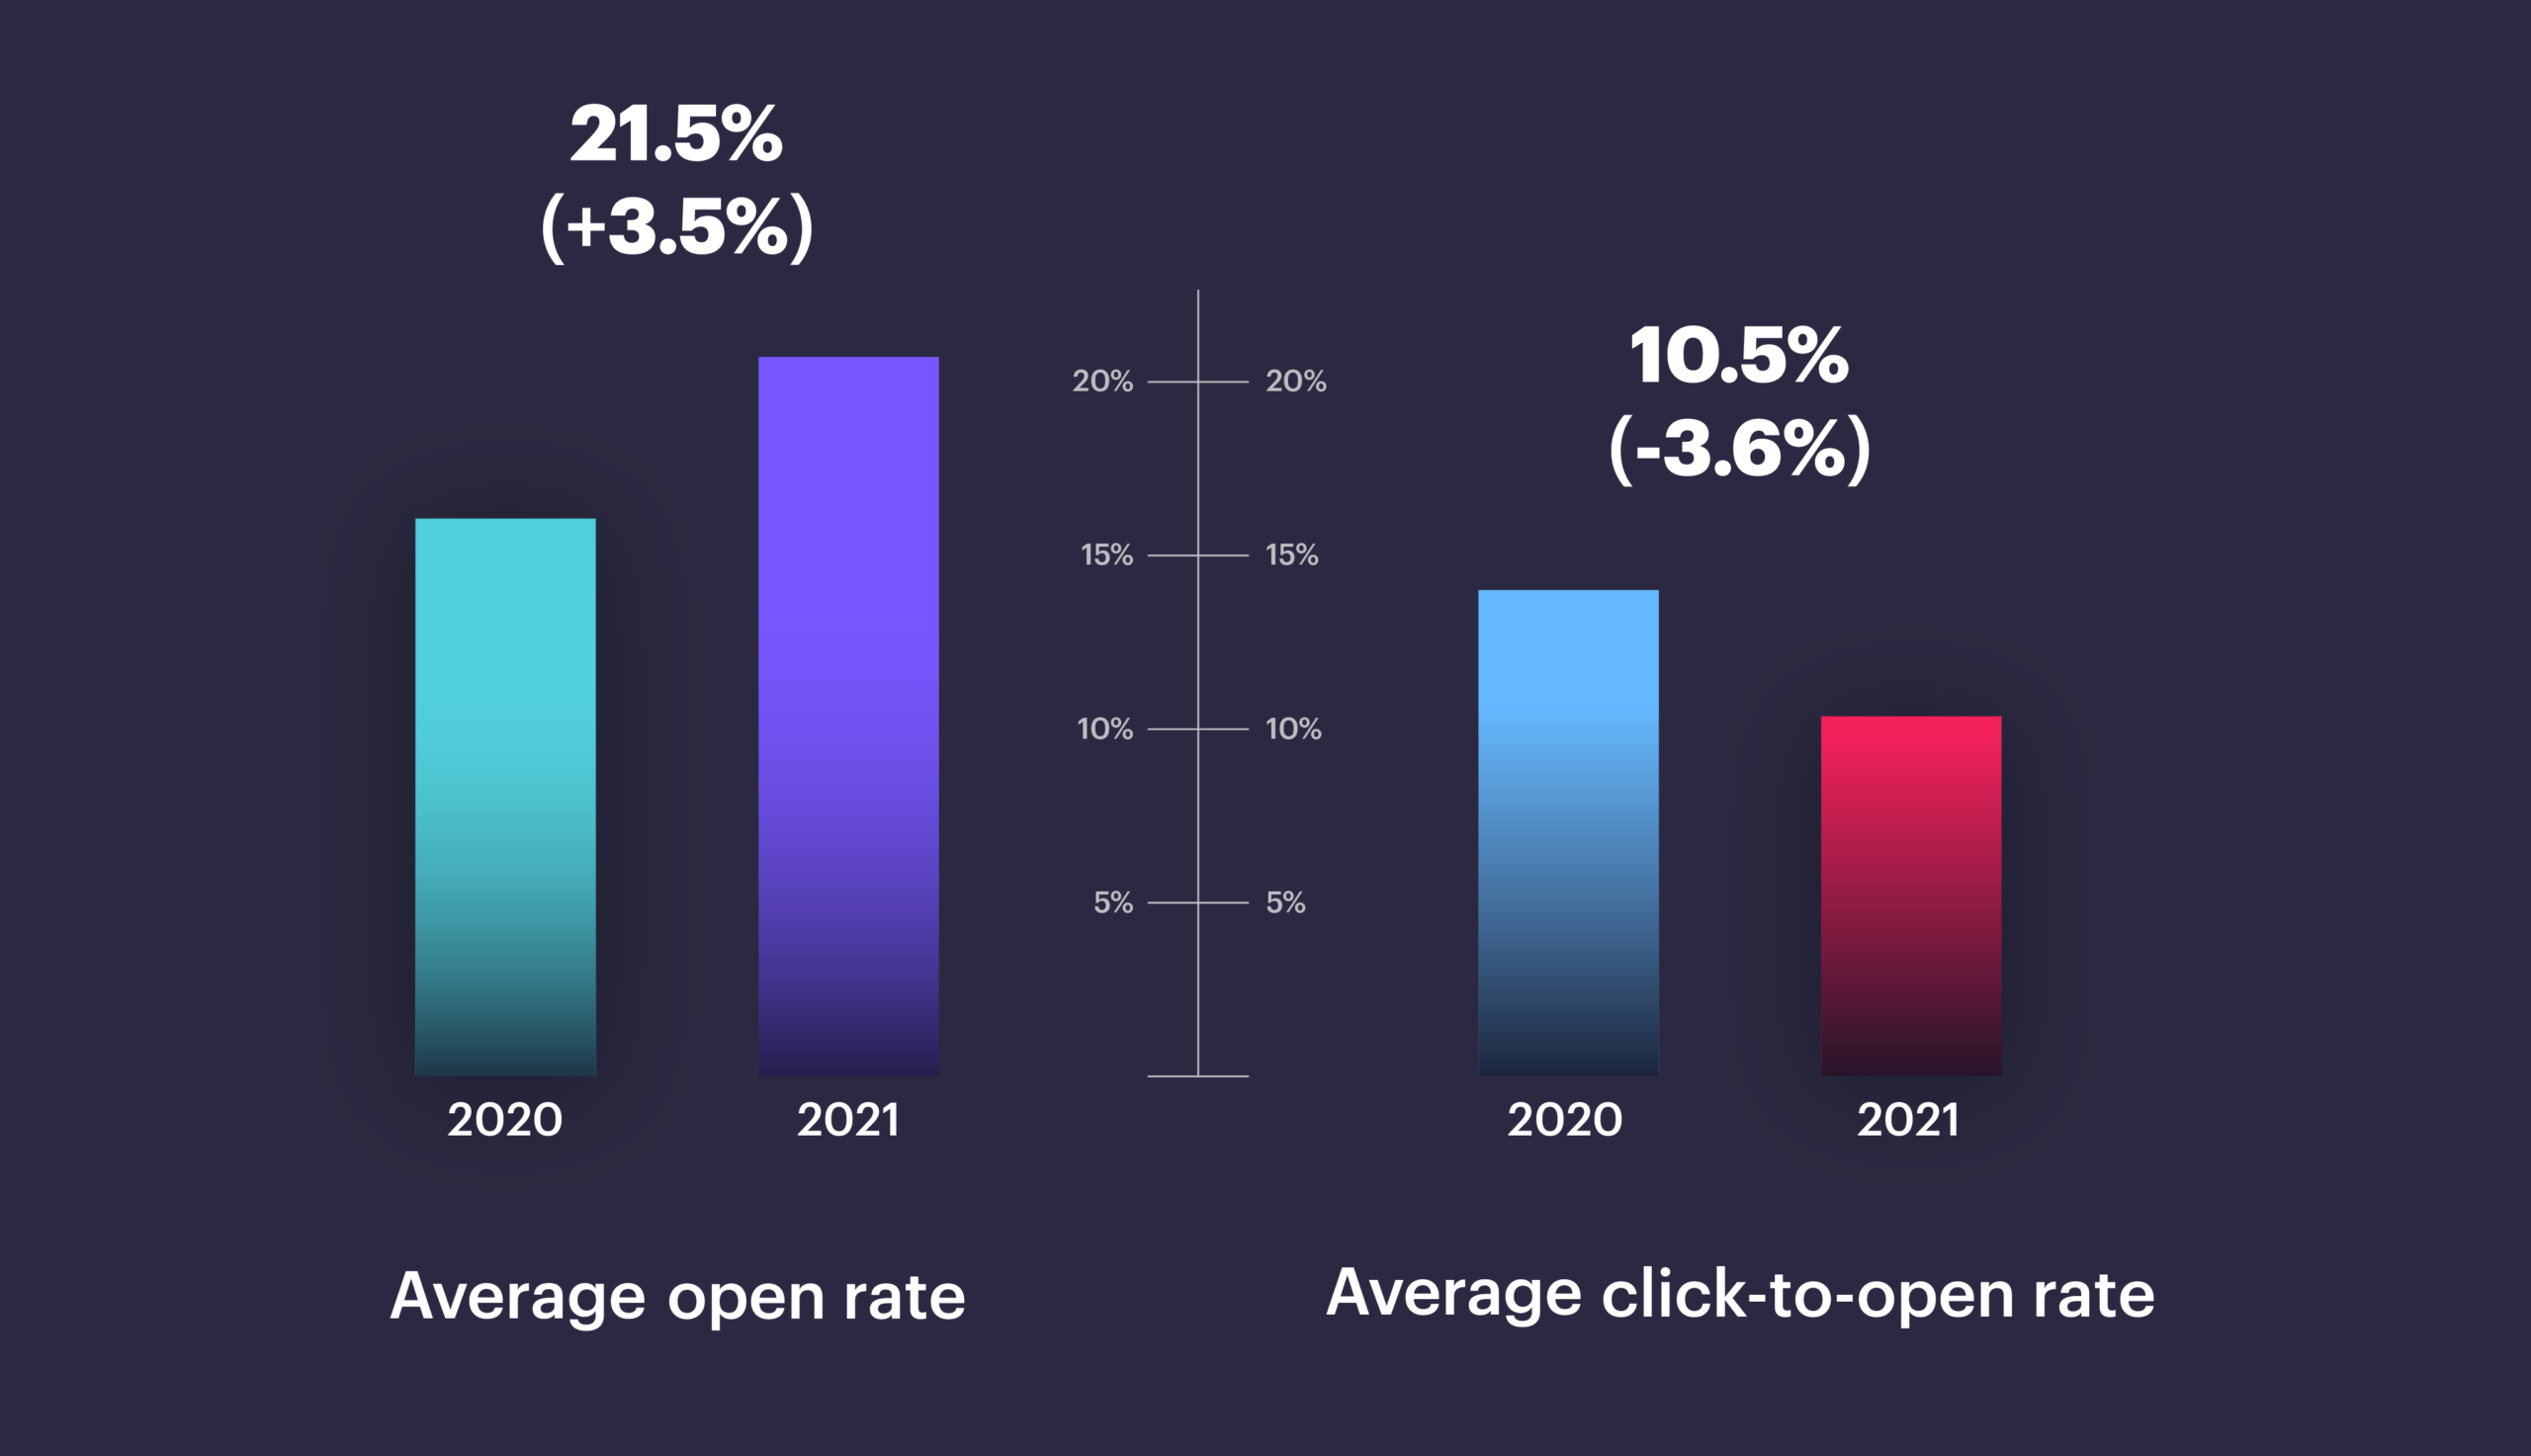
| Average Totals | 21.5%(+3.5%) | 2.3% (-0.3%) | 10.5% (-3.6%) | 0.1% (-) |
Looking at these metrics, it’s easy to spot some trends as they relate to events of the past year. The Education industry, for example, has the highest open rate, and the highest click-through rate at 28.5% and 4.4%, respectively. This makes sense, as schools needed to communicate with their students & parents more than ever for things like policies for COVID.

In our last report, Government & Politics took the top spot, which makes sense, given that 2020 was a huge election year in the US.
Retail is an interesting one to note. As an industry, it holds the title for both lowest open rate by industry (17.1%), and the biggest jump in open rate year-over-year, up 4.5%.
Real Estate, Design, & Construction has the highest click-to-open rate at 17.2% — no doubt riding the real estate boom in 2021.
We’re seeing the effects of Mail Privacy Protection
While it may not seem like much on the surface, those swings in average open rate across all industries (up 3.5% year-over-year), and click-to-open rate (down 3.6%) are pretty significant! And it turns out, there’s a reason for it.
For those unfamiliar with Mail Privacy Protection, it’s a new privacy feature, released by Apple in September 2021, that gives users more control over their data when it comes to their inbox.
MPP effectively disables open rate tracking by pre-fetching (or downloading) an email and its images (including each email’s tracking pixels). By doing this, MPP is marking an email as opened, artificially inflating open rates for each user that has opted into the new feature. For a deep dive on MPP, be sure to check out our guide.
When looking at the metrics year-over-year, it’s not hard to see how MPP is affecting open rates. But when you break it down on a month-by-month basis, it’s even easier to see.
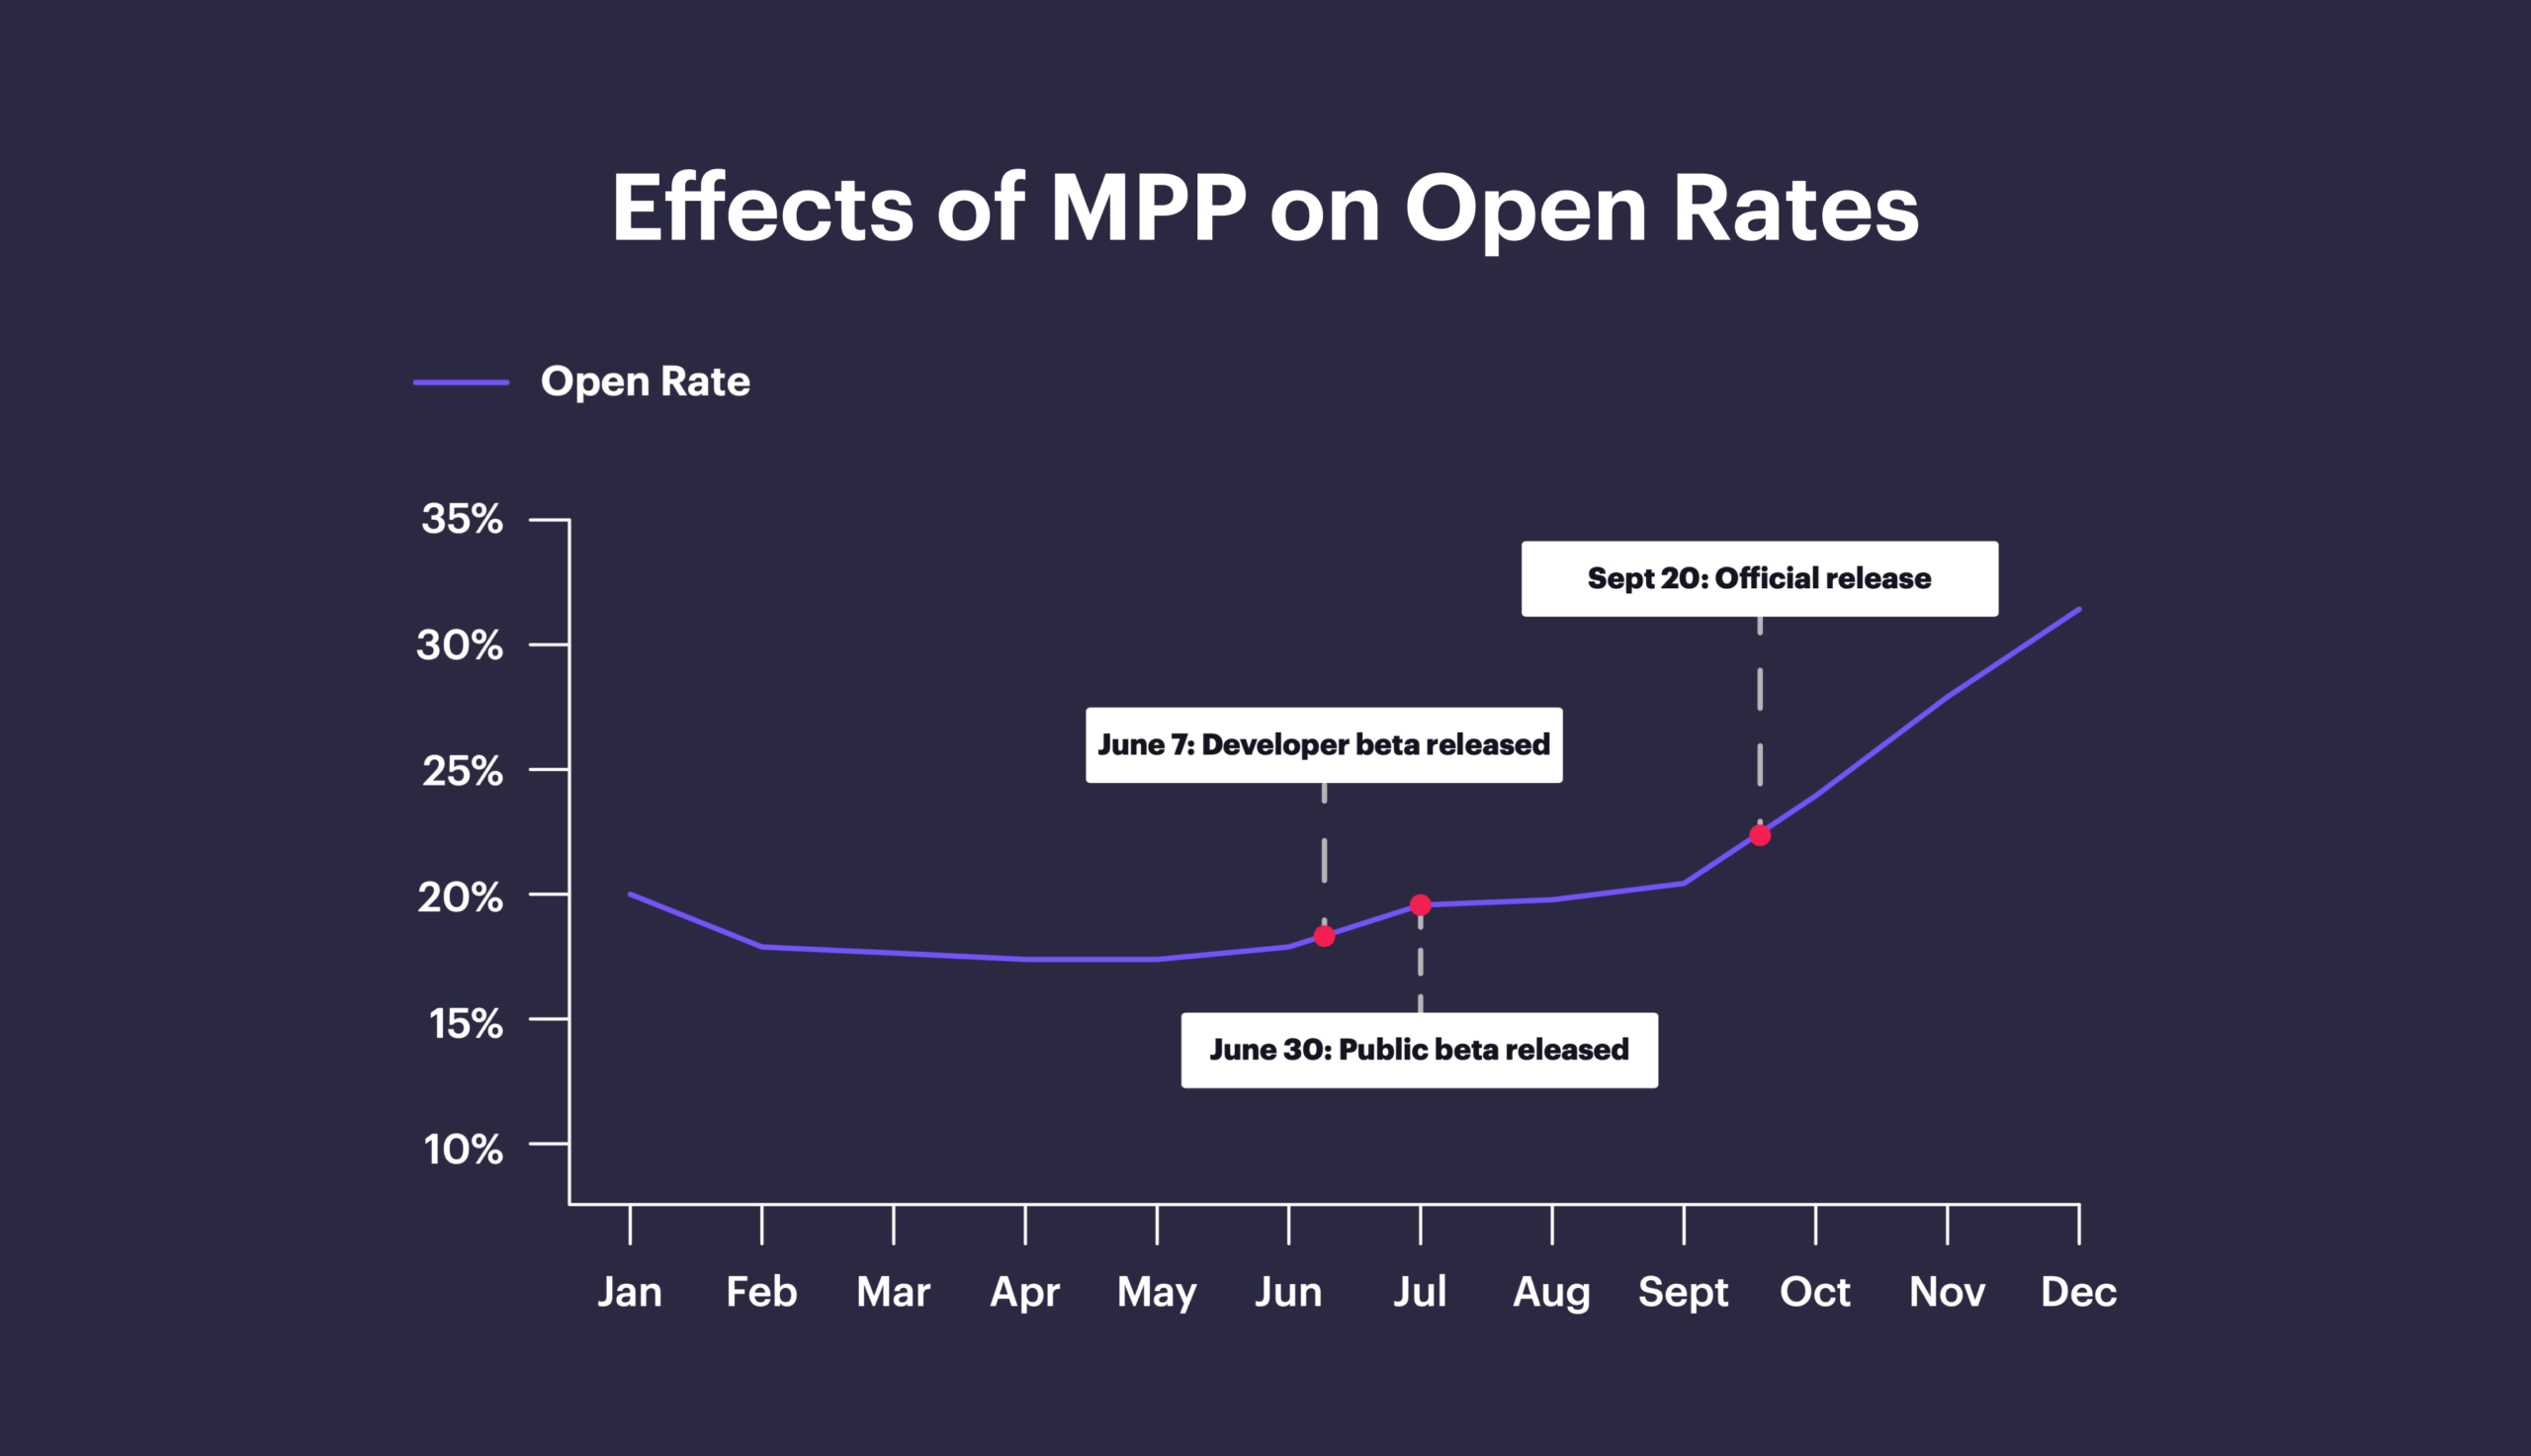
Notice the small uptick in open rates once the developer beta of iOS 15 was released on June 7th. Then again on June 30th, when the public beta came out. Then, once iOS 15 was publicly released on September 20th, we saw a huge uptick in open rates.
This is something we’ll likely see more of as users continue to activate the feature, so it’s definitely something to keep an eye on heading into 2022.
For more on MPP, check out our post on the future of open rates.
Email benchmarks by day
Every marketer swears that they know the best day to send emails, but do they have the proof to back it up? See if you’ve been sending on the right days this past year.
| Day of the week | Open Rate | Click-Through Rate | Click-to-Open Rate | Unsubscribe Rate |
| Sunday | 20.3% | 2.1% | 10.1% | 0.1% |
| Monday | 22.0% | 2.3% | 10.6% | 0.1% |
| Tuesday | 21.8% | 2.4% | 10.8% | 0.1% |
| Wednesday | 21.8% | 2.3% | 10.7% | 0.1% |
| Thursday | 21.7% | 2.3% | 10.7% | 0.1% |
| Friday | 21.6% | 2.2% | 10.1% | 0.1% |
| Saturday | 20.5% | 2.1% | 10.1% | 0.1% |
Best days to send marketing emails
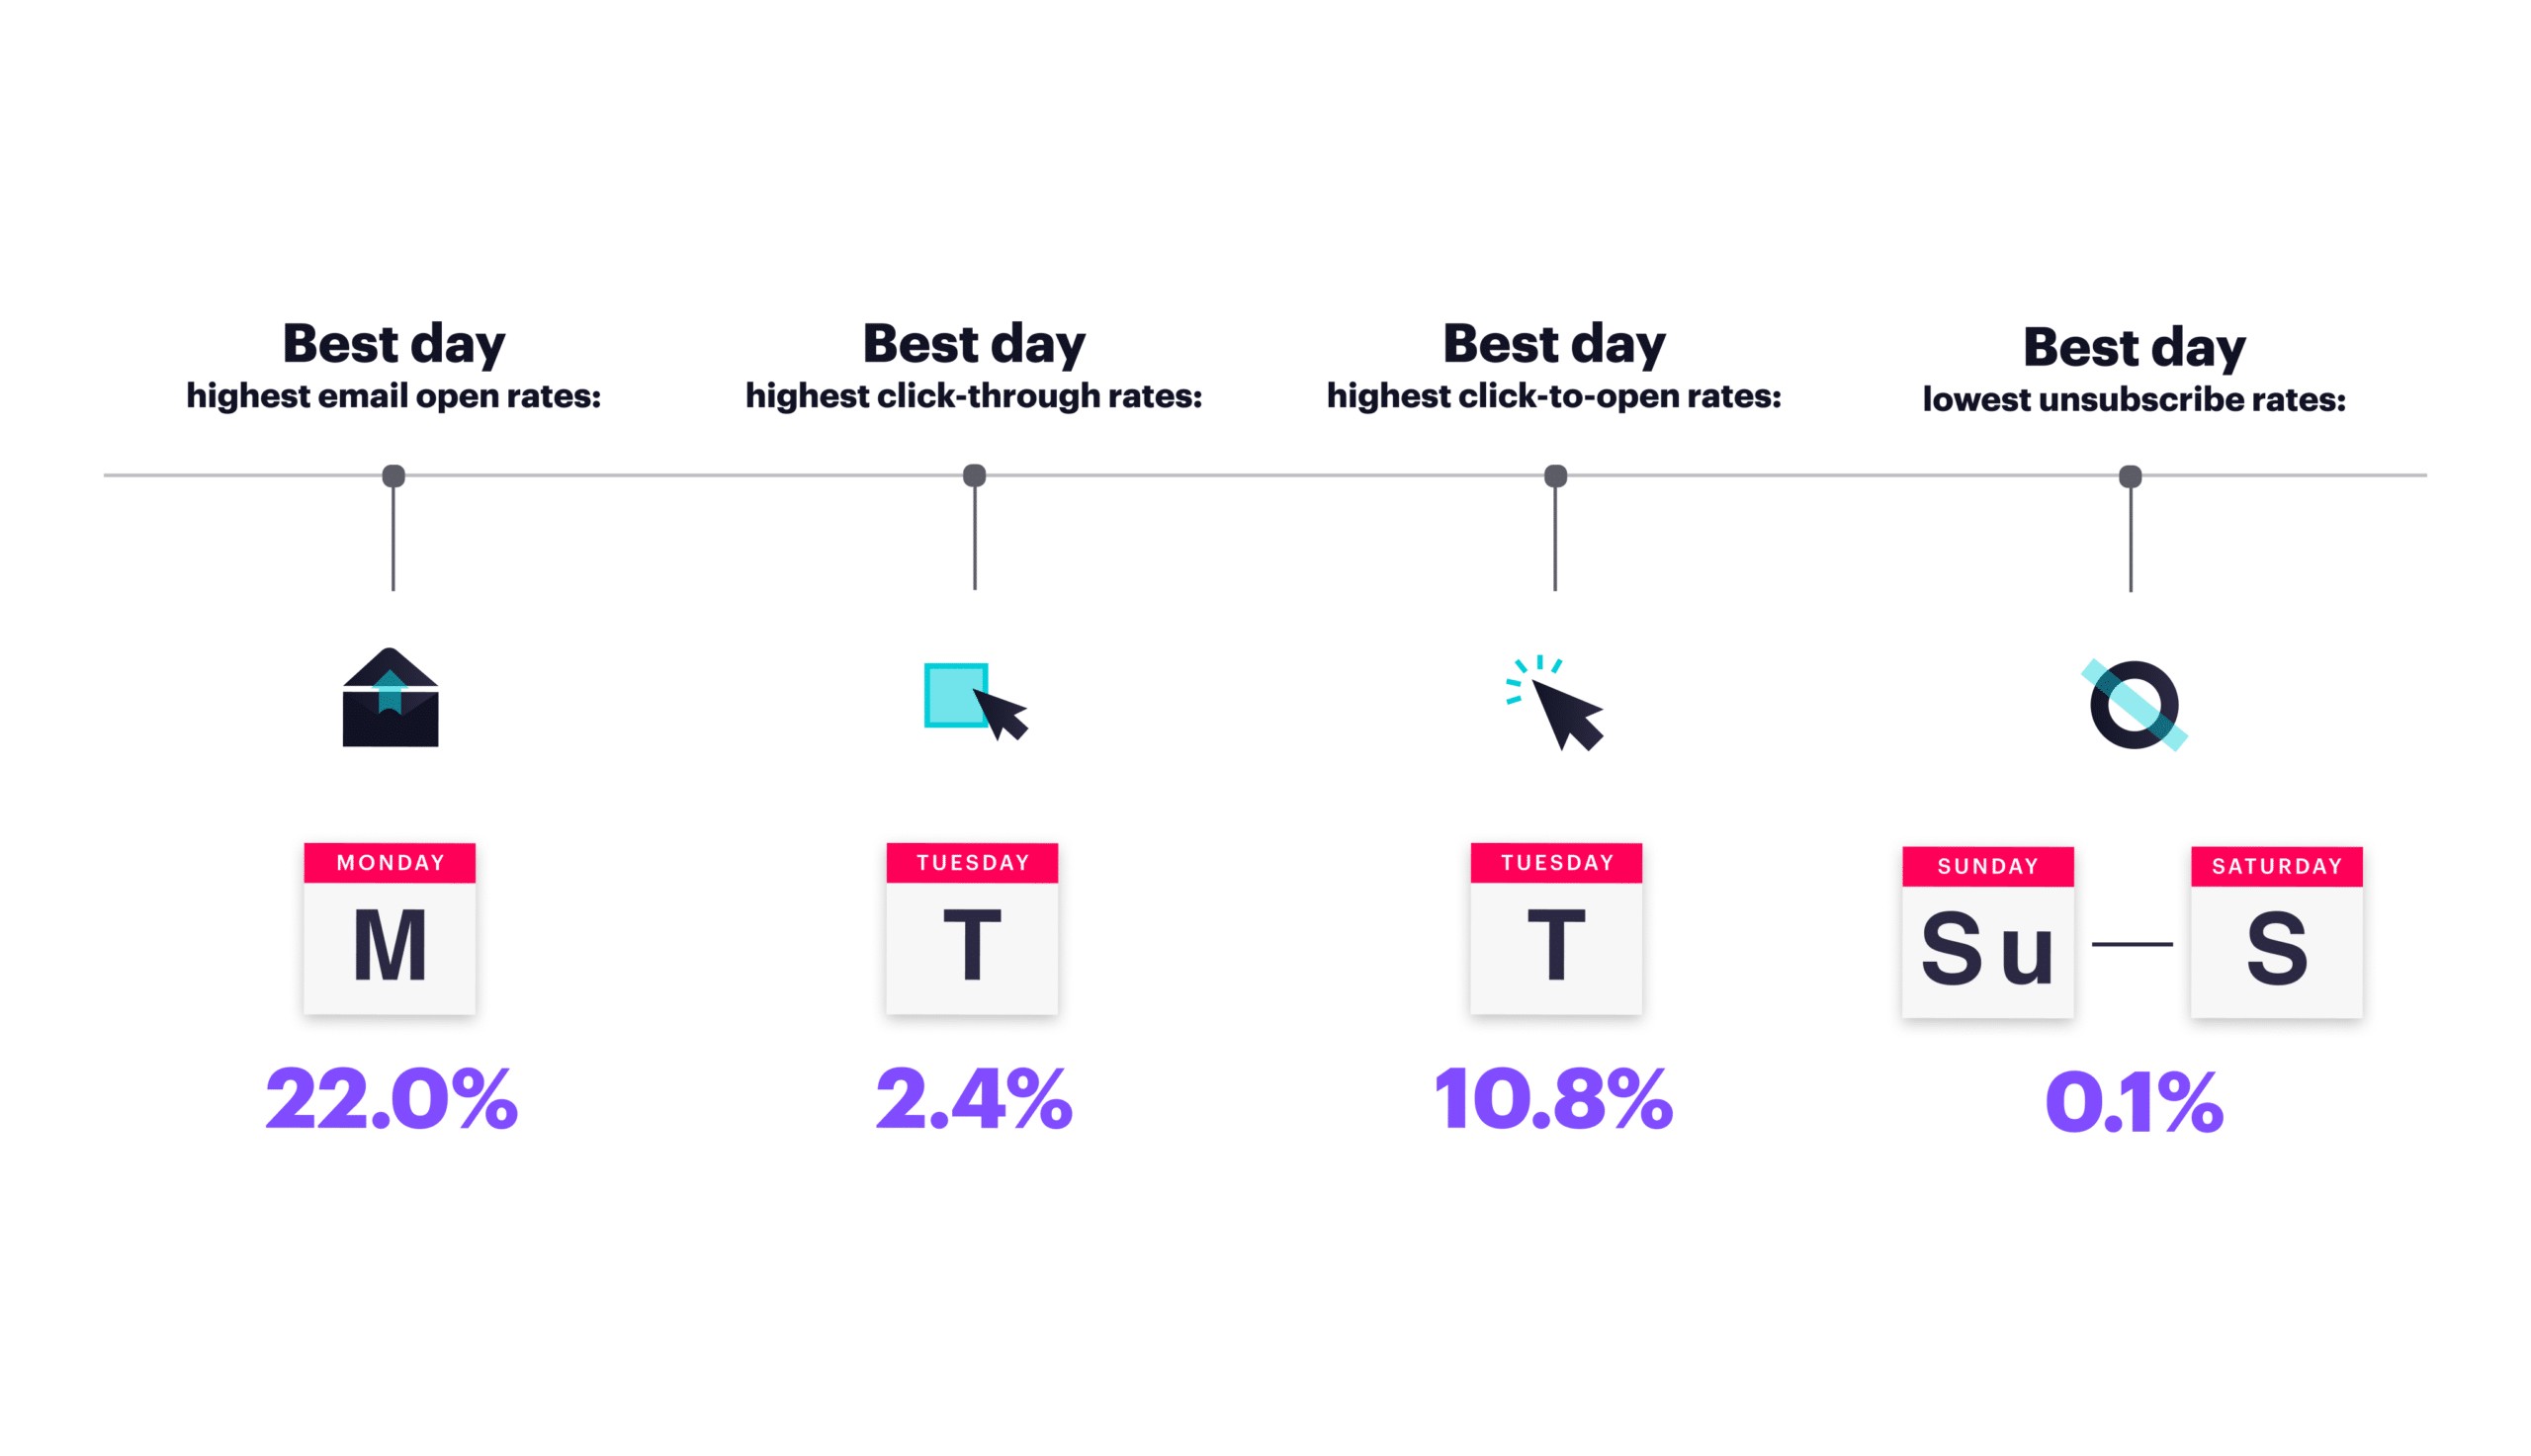
When looking at email statistics by day, there doesn’t seem to be too much variance in how emails perform on a given day. Overall, weekdays — as usual — tend to perform the best, with the lowest engagement numbers falling on the weekend.
- Best day with highest email open rates: Monday (22.0%)
- Best day with highest click-through rates: Tuesday (2.4%)
- Best days with highest click-to-open rates: Wednesday and Tuesday (10.8%)
- Email unsubscribe rates were virtually identical throughout the week (0.1%)
Worst days to send marketing emails
Based on the global averages by day shown above, these are the worst-performing days for sending.
- Worst day with lowest email open rates: Sunday (20.3%)
- Worst days with lowest click-through rates: Saturday & Sunday (2.1%)
- Worst day with lowest click-to-open rates: Friday, Saturday, Sunday (10.1%)
While this data is academically interesting, you should carefully consider your own audience and run email tests before blocking entire days off your campaign calendar.
Email benchmarks by region
It can be interesting to compare email benchmarks by region, and see how subscribers across the world respond to email. Though there aren’t huge gaps in engagement across regions, there are differences that are fascinating to look at.
| Region | Open Rate | Click-Through Rate | Click-to-Open Rate | Unsubscribe Rate |
| AMER | 21.0% | 2.2% | 10.4% | 0.1% |
| UK | 22.9% | 2.4% | 10.6% | 0.1% |
| EU | 22.1% | 2.2% | 10.7% | 0.2% |
| APAC | 22.4% | 3.0% | 13.4% | 0.3% |
The Asia-Pacific (APAC) region has the highest engagement rates across the board — including the highest unsub rates. Clearly, subscribers from this region are engaging with email marketing, but they’re also keeping a close watch on who they let in their inboxes.
How to improve your email marketing metrics
Increase your email open rate
One of the most common questions we hear from marketers is “how can I improve my email open rates?” While MPP now obscures the accuracy of open rate as a metric, that doesn’t mean we should stop adhering to open rate best practices. We recommend a thoughtful approach that focuses on providing value to your subscribers, communicating with them when they want to hear from you, and always paying off the promise of your messages.
Here are some tips to help improve your email open rate:
- Improve your subject lines
- Test subject line length, tone, and content
- Optimize for previews with preheader text
- Test sender name and email address (ex. company name vs. CEO’s name)
- Test send day, send time, and send cadence (ex. daily vs. weekly)
- Ensure relevant content through personalization and segmentation
Increase your email click-through rate (CTR)
When we talk about click-through rates, what we’re really measuring is subscriber engagement with each part of your email. We can see what resonated in the message, including notable hyperlinks, strong CTAs, and compelling images.
Your click-through rate offers insight into how many of your total subscribers are visiting your website and ultimately convert through email. Comparing your open rates, click-to-open rates, and your click-through rates can reveal where your email marketing campaign is weakest.
Here are some tips to help improve your click-through rate:
- Create stronger segments so you always send the most relevant content
- Refresh your templates or start over by building a new a custom template
- Maintain your brand voice throughout your messaging
- Improve your calls-to-action through clear copy and better design
- Offer strong incentives to capture subscribers’ attention
- Ensure your subject line accurately reflects the content of your emails
- A/B test what works
Increase your email click-to-open rate (CTOR)
CTOR is a good indicator of how interesting your content is to your subscribers. If your links, layout, copy, and overall content are interesting, then a greater percentage of your audience will want to click through to learn more.
CTOR may be a bit more skewed thanks to MPP, but it’s still worth keeping an eye on. A high click-to-open rate is a sign of engaging content and strong calls-to-action.
Here are some tips to help improve your email click-to-open rate:
- Make sure your email renders well across devices
- Collect the right data to segment and personalize
- Optimize your email design and copy
- Include an irresistible, easy-to-click call to action
- A/B test each email element individually
- Automate your emails to scale what works
Decrease your unsubscribe rate
People unsubscribe from emails for a variety of reasons. You could be sending too many messages or have an unknown issue with formatting. Some of your readers may even have signed up inadvertently and are no longer interested.
While it may be counterintuitive, it’s actually better for your email marketing if these unengaged contacts aren’t on your subscriber list. They’re probably dragging down your email performance because they aren’t opening or clicking on your messages. However, that doesn’t mean you want a mass exodus of subscribers from your contact lists. The goal should be to build your sender reputation while maintaining engaged lists.
Here are some tips to help reduce your unsubscribe rate:
- Grow a healthy list from the start
- Ask subscribers why they stopped reading
- Use automation to build long-term brand engagement
- Segment your audience to send more relevant emails
- Re-engage your audience to maintain list hygiene
- Remember that some list churn is normal and healthy
Decrease your email bounce rate
Bounced email addresses can be one of the most frustrating aspects of email marketing. Luckily, there are a few things you can do to help your emails make it to your readers’ inboxes.
Here are some tips to help reduce your email bounce rate:
- Don’t send to stale email lists
- Never use purchased email lists
- Remove invalid email addresses
- Use confirmed opt-in
- Never use free webmail addresses
- Avoid spammy content
- Suppress previous bounces
Improve your email deliverability
Deliverability is the universal struggle among marketing teams; you can get so many things right when developing high-quality content, but still struggle to get it in front of your audience.
Issues with ISPs, throttling, bounces, spam issues, and bulking hurt your deliverability and thus reduce the number of your emails that will land in your subscribers’ inboxes
That’s why your deliverability will impact everything from open rates to clicks to spam reports, so prioritizing this will have a huge impact on your email marketing success.
Here are some tips to help improve your email deliverability:
- Send using custom authentication
- Using double rather than single opt-in
- Make it really easy to unsubscribe
- Avoid using URL shorteners
- Don’t send from a no-reply email address
- Don’t send emails with too many images
Email, as always, is very much alive
Email marketing continues to perform well, bringing in major ROI for businesses around the world. Owning your data and connecting with customers where they already are—in their inboxes—can be huge factors when it comes time to measure the success of your marketing methods.
We often hear from customers that they know email marketing works, but they aren’t sure exactly how to tap into the channel to see the results they need to keep their brand growing. With these benchmarks, you can see exactly how your email strategy compares, and where a little bit of time and focus will lend itself to the biggest results.
Notes about terminology
Whenever you see us discussing “averages,” we find these averages using all campaigns. Some industries send more emails than others, so we calculate averages by all campaigns sent, regardless of industry.
You’ll also see an “Other” category in the list of industries. These are Campaign Monitor accounts that don’t fit into a particular industry, or the industry for these accounts isn’t listed.